What's new in Microsoft Chart Control (MSChart) Extension Version 3
Introduction
MSChart Extension is an extension class for Microsoft Chart (MSChart) control in Visual Studio for WinForms applications. The tool was first published on July 2012 with the intention to overcome some of the limitation from the original MSChart and provide new functions. With zoom, pan and cursors added, the stock MSChart components can be use as an oscilloscope for waveform display and inspection.
The source code and compiled package is available for download at:
Articles regarding the previous release is available here: MSChartExtension Articles
In this article, we will explore what are the new features included in Version 3, let's have a look.
We tried to maintain backward compatibility with previous release to minimize changes required to your project, some of the methods and implementation had to be change for better implementation.
New Features
Chart Cursor Label Formatted String (Prefix, Postfix)
Cursor label text properties in ChartCursor class changed as follow:
//Version 2
public String FormatXValue();
public String FormatYValue();
public String NumberLabelFormat { get; }
public String FormatYValue();
public String NumberLabelFormat { get; }
//Version 3
public String XFormattedString { get; }
public String YFormattedString { get; }
public String YFormattedString { get; }
X and Y value to string conversion is now handle by FormatCursorValue method to handle conversion from different value type in MoveCursor and MouseDown event. Besides, new properties added in ChartOption class to define format value for each cursors.
public String CursorLabelPostfixX1 { get; set; }
public String CursorLabelPostfixX2 { get; set; }
public String CursorLabelPostfixY1 { get; set; }
public String CursorLabelPostfixY2 { get; set; }
public String CursorLabelPrefixX1 { get; set; }
public String CursorLabelPrefixX2 { get; set; }
public String CursorLabelPrefixY1 { get; set; }
public String CursorLabelPrefixY2 { get; set; }
public String CursorLabelStringFormat { get; set; }
public String CursorLabelStringFormatX1 { get; set; }
public String CursorLabelStringFormatX2 { get; set; }
public String CursorLabelStringFormatY1 { get; set; }
public String CursorLabelStringFormatY2 { get; set; }
Example below show cursor label with following configuration:

Configuration Dialog (Color Settings)
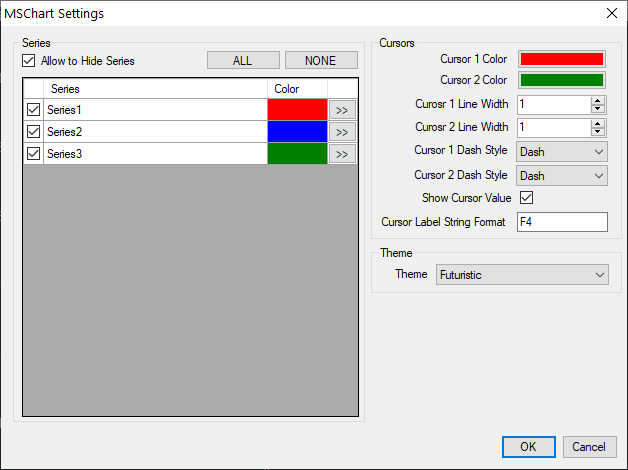
In Version 3, we introduced a new settings dialog accessible from Context Menu with right mouse click. With this configuration dialog, you will be able to configure which series to show, as well as select the color for each series and cursors. Color selection palette is implemented using Cyotek Color Picker Control.
Navigating Cursor over Data Points
Then snap to nearest data point algorithm had been improved in Version 3 release. In addition, we added capability to move cursor to next or previous data point when key < or > is pressed. The same function can be done with Left and Right Arrow key when KeyPreview property is set to True in parent form.
Theme
Properties Theme added to ChartOption class to quickly change design style of the chart components to make data more readable. Theme can be either configure from code or change during runtime. Do note that series color will not be affected by theme settings.

Buffered Mode
The whole package is consider incomplete without this feature. Buffered mode is implemented to visualize large data size with small amount of data points but still preserved the waveform characteristic. One issue for chart components in displaying large amount of data size is the huge consumption of memory and slow response. With buffered mode, spikes and troughs of a waveform will be preserved when reducing number of data points for better performance.
Example below shows the waveform between full waveform of 5000 data points and down sampled waveform of 800 data points using buffered mode.
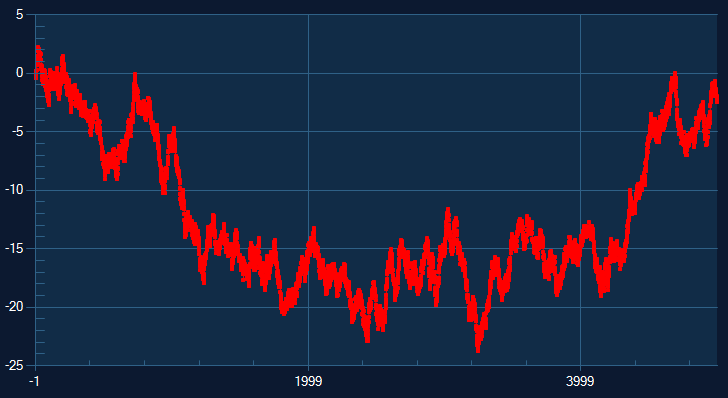
Random data 5000 points

Buffered data 800 points
To use buffered mode, first enable BufferedMode and set DisplayDataSize in ChartOption when calling method EnableZoomAndPanControls as shown below:
new ChartOption()
{
...
BufferedMode = true,
DisplayDataSize = 800
...
});
{
...
BufferedMode = true,
DisplayDataSize = 800
...
});
Next, add data points to series using the following extension method for Series class.
series.AddXYBuffered( xvalue, yvalue);
With buffered mode, maximum data points to display on chart is defined in DisplayDataSize properties. For data with large data size, the details of the waveform will be drawn when the chart is zoomed in. The algorithm of buffered mode is implemented using Largest-Triangle-Three-Buckets algorithm as described in Sveinn Steinarsson's Master Thesis.
Details of implementation of LTTB in MSChart Extension will be discussed in deep in next article, stay tuned.